")
 (2)")


Monte Carlo Simulation for a Sugarcane Investment Project
Objective
The goal of this Monte Carlo simulation model is to evaluate the financial viability of a sugarcane cultivation investment project under uncertainty. By incorporating probabilistic assumptions for key input variables—such as inflation, local and international sugar prices, exchange rate (TRM), and cost volatility—the model allows stakeholders to better understand the range of possible Net Present Value (NPV) and Internal Rate of Return (IRR) outcomes

Context of the Case
A Colombian agribusiness company was evaluating the feasibility of investing in 1,000 hectares of sugarcane cultivation. The decision required a robust financial model to analyze the project’s profitability under uncertainty. While a deterministic Excel model had already been built, it provided only one static outcome, failing to reflect the risks and variability inherent in key drivers such as:
- Sugarcane yield per hectare
- Sucrose content
- Selling prices (local and export)
- Foreign exchange rate (TRM)
- Inflation rates
Input Excel: Download
To address this, I developed a Monte Carlo simulation tool in Python, fully integrated with the existing Excel model. This allowed the company to:
- Quantify the risk of negative returns
- Visualize thousands of future scenarios
- Make more informed decisions based on a range of financial outcomes
The simulation was designed to be run directly from Excel via a button, allowing non-technical users to run it repeatedly, update inputs, and understand the risk profile without modifying the formulas or breaking the model.
Python Code: Download
Understanding
The simulation was implemented in Excel, enhanced with VBA and xlwings in Python to enable automation and dynamic reporting. A total of 10,000 iterations were executed, using historical data to define probability distributions for each input. The model generates key financial metrics (NPV and IRR) and visualizes the results using a histogram with KDE (Kernel Density Estimation), rug plot, and median line. The interface also includes interactive buttons for running simulations and resetting inputs.
Technology Stack
Python using Jupyter Notebook
xlwings – for reading/writing Excel files and triggering Excel calculations.
Matplotlib & Seaborn – for statistical visualizations.
Microsoft Excel – for the deterministic model structure and calculations
Macro:
Conclusion
The results show a mean NPV of $7.54 billion COP and median NPV of $7.48 billion COP, with a 0.5% probability of loss based on 10,000 simulations. The IRR is equal to 31%, significantly above the cost of equity (10.5%). These results suggest the investment project is highly attractive and resilient to the simulated variations in key assumptions.
Anomaly Detection in Journal Entries with an Autoencoder
Objective
Prioritize unusual journal entries without hard-coded rules, so auditors focus on a small, high-risk subset while maintaining coverage..
Context
Industry: Personal-care manufacturing (Colombia)
Period: Fiscal year 2024
Volume: 39,681 journal entries (~100k rows)
Why this approach: Rule lists and manual filters miss novel patterns and are costly to maintain. An unsupervised method learns normal behavior and highlights what doesn’t fit.
Data
Per-line fields
Document number, Posting date, User SAP, Document type, Transaction type, GL account (Colombian PUC 6 digits), Account name, Debit, Credit, Amount (= Debit − Credit).
Structure
Entries have 2–6 lines and typically balance to zero.
Governance
PUC catalog (6 digits), user roles with segregation of duties, coherent document types, and accounting controls (e.g., Sales→A/R; Purchases/Expenses/Fixed Assets→A/P; Adjustments never touch banks; petty cash is 110510).
Data_Base: Download
Business understanding & controls (normal behavior)
Sales (VT): must hit 112005 Accounts Receivable; collections via RC.
Purchases / Expenses / Fixed assets (CP/GO/AF): must hit 210505 Accounts Payable; payments via PP (CE).
Adjustments (AJ): do not touch bank or client accounts.
Petty cash: 110510 (not 111005).
Segregation of duties: Purchasing=FC; Treasury=RC/CE/ND; Accounting=NC; Payroll=NE.
Validation ground truth (controlled fraud)
Purpose: a small, realistic benchmark to check whether an unsupervised model surfaces real risks.
Volume: 25 entries dispersed among 39,681 documents.
Examples: Sales without A/R; CP/GO/AF without A/P or posted directly to banks; Adjustments hitting bank accounts; petty cash using 111005; invalid document↔transaction pairings; role violations.
Label handling:
Fraud/Fraud_reasonremoved before training and used only for post-hoc evaluation.
journal_entries_Label _FraudFraud_reason: Descargar
Methodology
Feature engineering (document-level)
Aggregations per Document number capture the logic of the whole entry:
- Amounts: sum_debit, sum_credit, absolute net_amount, avg_line_abs, n_lines, n_gl_unique.
- Categoricals: user_sap, document_type, transaction_type, month, weekday.
- Accounting signals: flags for key GLs (111005, 112005, 210505, 110510, 410505, 510505, 150405, 220505, 240805/240815, 143005, 520505, 159205) and PUC class proportions (1–7).
- Preprocessing: One-Hot (categoricals) + StandardScaler (numericals).
Model (autoencoder)
Architecture: 64 → 32 → 8 (bottleneck) → 32 → 64 with BatchNorm, Dropout, L2; loss = MSE.
Training: 80/20 split, early stopping.
Threshold: 99.5th percentile of reconstruction error (MSE). Above threshold = suspicious.
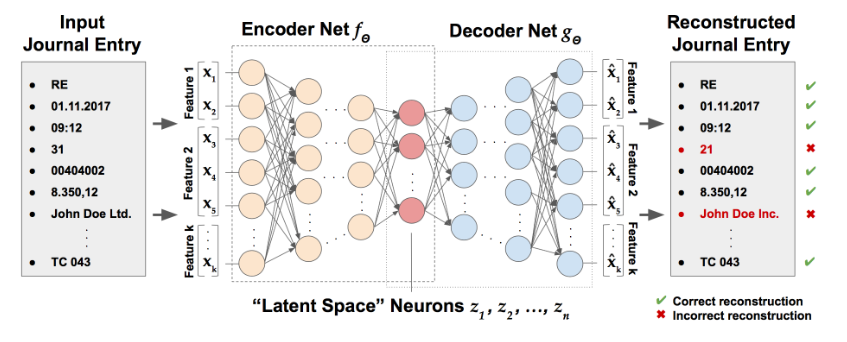
What “reconstruction” means
The network learns what a normal entry looks like.
It compresses each entry into a compact 8-neuron memory.
It rebuilds the entry from that memory.
The difference between input and rebuilt version is the reconstruction error.
Low error: looks normal.
High error: unusual mix (e.g., Sales without A/R) → prioritize for review.
Analogy: a copier trained with normal entries; odd documents come out “blurry” where the oddities are.
Results
Highlights
199 entries flagged (~0.5% of 39,681).
25/25 controlled frauds ranked in the Top-25 by score (perfect recall on planted cases).
Common patterns flagged: duty-segregation violations; Sales without A/R; CP/GO/AF without A/P; Adjustments touching banks; non-zero net totals.
Doc_Scores: Download
Technology used
Python, TensorFlow/Keras, scikit-learn, pandas, NumPy, openpyxl.
Versioned artifacts: preprocessor (
.pkl), model weights (.h5), threshold (.txt).Outputs:
Doc_Scores.xlsx,Journal Entries Etiquetado.xlsx.
")